


At a glance (5 minute read)
- British Columbia, Nova Scotia, and New Brunswick have the highest share of out-of-province and non-resident investors in residential real estate.
- Residents aged 55 and older own a significant proportion of investment properties.
- Established immigrants are overrepresented among investors, with higher property values but lower average income compared to Canadian-born investors.
In recent years, there’s been growing concern about the role of residential real estate investors in Canada.
While investors provide much-needed rental stock, they can also limit housing market access for first-time home buyers and contribute to rising house prices. [1]
Who are these investors in residential real estate?
A newly released Statistics Canada profile looks at the demographic characteristics of investors, including age, sex, and immigration status, and where they bought residential properties.
The study focuses on four provinces: British Columbia, Ontario, Nova Scotia, and New Brunswick in 2020 (most recent data) and was conducted by the Canadian Housing Statistics Branch of Statistics Canada.
Key findings
- BC, Nova Scotia, and New Brunswick had the highest share of out-of-province investors and non-resident investors.
- Residents aged 55 and older own a higher proportion of investment properties than other any age bracket.
- Established immigrants – those who landed before 2010 – were overrepresented among investors relative to their share of the provincial populations.
- Women represented half of all resident investors.
What is an investor?
Investor: is an owner of at least one residential property that is not used as their primary place of residence. This includes:
- A business or government that owns at least one residential property, excluding Canadian non-profit organizations. These are known as a “business investor.”
- A person who is not a current resident of Canada and is a residential property owner, referred to as a “non-resident investor”.
- A person who lives outside the province where they own residential property, referred to as an “out-of-province investor” in the province of the non-principal residence.
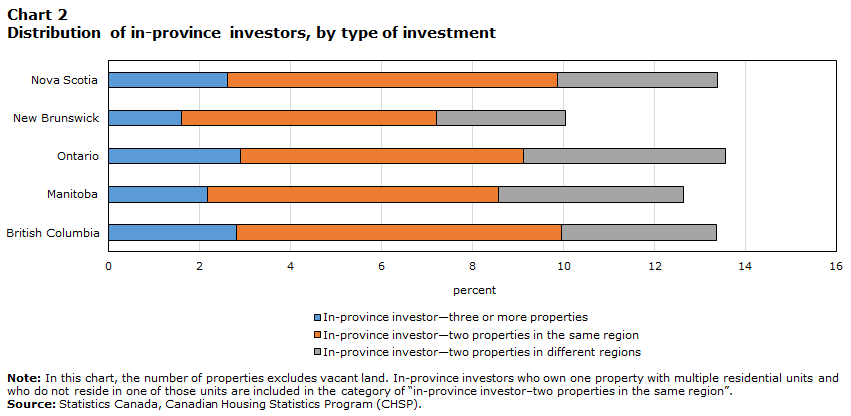
- A person who lives in the province and owns two or more residential properties, or owns a property with multiple residential units and does not occupy that property. These persons will be referred to as “in-province investors”.
Investor-occupants own a single property with multiple residential units. One unit is their primary place of residence. This includes owners of a house with a laneway unit or basement suite and owners of a duplex who live in one of the units.
Non-investors are owners who are not an investor or an investor-occupant. This category primarily includes owners of a single property that does not have multiple residential units who live in the province where their property is located. Canadian non-profit businesses are also included in this category.
Investor types across provinces
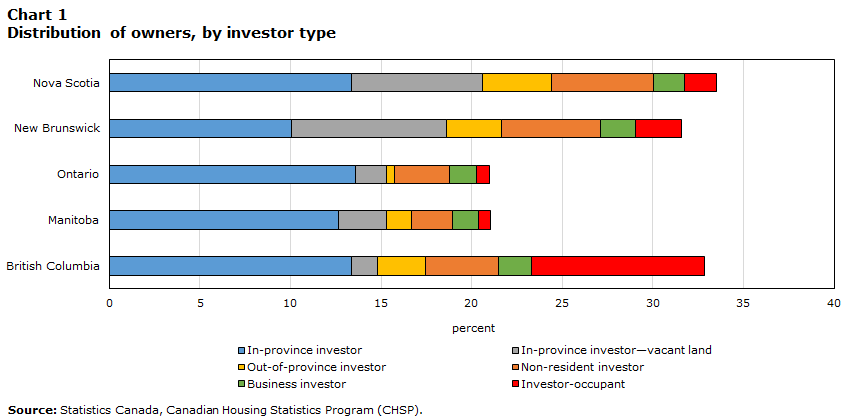
The rate of out-of-province investors by province:
- Ontario (0.5%),
- Manitoba (1.4%),
- BC (2.7%),
- New Brunswick (3.0%), and
- Nova Scotia (3.8%).
BC
- The rate of investor-occupants in BC is 9.6%.
- Higher rates of out-of-province investors were found in areas along the southern portion of the BC-Alberta border. For example, in Invermere, 40.9% of owners were out-of-province investors. In Radium Hot Springs the rate was 69.2%.
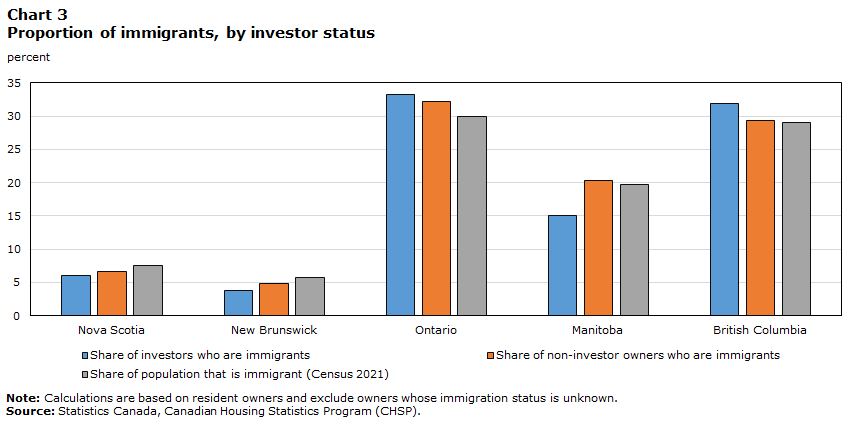
Established immigrants are investors at higher rates than Canadian-born residents
The share of home owners who are immigrants in each province corresponds closely to the share of immigrants in the overall provincial population.
In BC, immigrants in general and established immigrants were overrepresented among investors, relative to their share of the provincial population.
- The assessed value of the property holdings of immigrant investors is higher than that of Canadian-born investors in all five provinces.
- The average assessed value of immigrant investors’ total property holdings was $2,200,000 in BC compared with $1,610,000 for Canadian-born investors.
- In BC, the average income of immigrant investors was lower than that of Canadian-born investors.
- Canadian-born investors had an average individual income of $105,000, whereas immigrant investors had an average individual income of $80,000.
The majority of investors are 55 and older
Residents aged 55 years and older were overrepresented among home owners relative to their share of the population.
Canadians younger than 35 were significantly underrepresented among investors relative to their share of the adult population (Chart 5).
This underrepresentation likely occurred because younger investors had fewer income-earning years, making it more difficult to accumulate the financial capital required for home ownership and real estate investment.


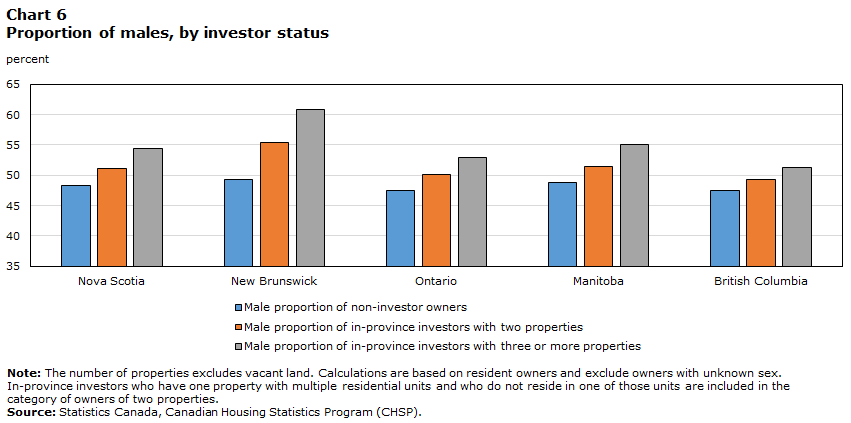
Men are overrepresented among investors with three or more properties
- Women and men constituted a similar proportion of investors. Among resident investors, the proportion of investors who are male in BC is 50.2%.
- Men were overrepresented among investors with three or more properties in the housing stock.
- The average assessed value of investors’ real estate holdings was similar between men and women in all five provinces.
The average income of female investors was significantly less than that of male investors. This disparity was the largest in BC where the average income for male investors was $125,000 compared with $70,000 for female investors.
There is a significant presence of investor-occupants in urban BC
In some expensive urban markets, densification has produced a high number of properties with multiple residential units, such as rental apartment buildings and condominium apartment towers.
While densification can take the form of large buildings, it also includes single-detached houses with secondary suites or laneway units, duplexes, and triplexes. This form of density produces high rates of investor-occupants (those who own a single property with multiple residential units and live in one of the units).
In the Vancouver CMA, 12.5 per cent of owners were investor-occupants. In Vancouver city, this proportion was 15.9 per cent.
Investor-occupants had average incomes that were similar to those of non-investors, but lower than investor incomes. In the Vancouver CMA, the average income for investor-occupants was $65,000, compared with $65,000 for non-investors and $100,000 for in-province investors.
The average assessed value of the properties owned by investor-occupants was higher than that for non-investors in BC.
In the Vancouver CMA, the properties of investor-occupants had an average assessed value 34.7 per cent higher than the properties of non-investors, while in Victoria they were six per cent higher.

Other Canadian Housing Statistics Branch releases have examined variations in the rates of:
These investor types are not detailed here.
Read the full report, A profile of residential real estate investors in 2020, released May 23, 2023.
